O nas
VODSTVO
NAŠI TRGI
SKLADNOST POSLOVANJA
Izberite regijo in jezik

Izberite regijo in jezik
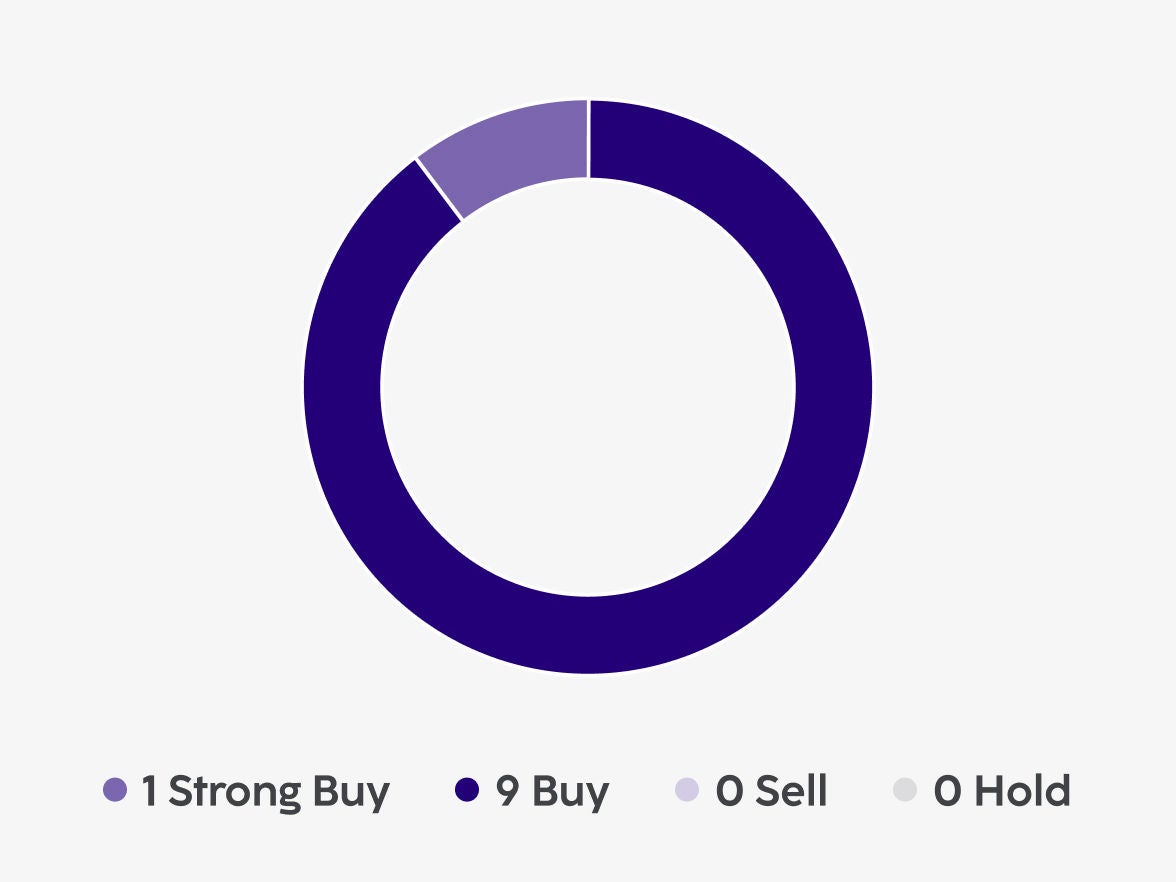
Ocena nakupa
Ocena temelji na osnovi desetih analitikov, ki močno priporočajo nakup delnice NLB.

Napoved vrednosti delnice
Srednja ocenjena vrednost gibanja delnice NLBR po ocenah 10 analitikov je postavljena pri 162,5 EUR za delnico.
| Income Statement (EURm) | 4Q24E | 2024E | 2025E | 2026E | ||||
|---|---|---|---|---|---|---|---|---|
| Median | Average | Median | Average | Median | Average | Median | Average | |
| Net interest income | 235.0 | 234.8 | 926.0 | 904.4 | 925.2 | 909.7 | 926.0 | 927.8 |
| Net fee and commission income | 83.8 | 83.8 | 314.6 | 308.4 | 327.6 | 324.7 | 346.9 | 344.2 |
| Other operating income | 0.0 | -1.9 | -1.4 | -0.5 | -9.0 | -1.7 | 1.1 | 2.8 |
| Total net operating income | 319.8 | 316.7 | 1,243.3 | 1,212.3 | 1,252.8 | 1,232.7 | 1,273.4 | 1,274.9 |
| Employee costs | -81.6 | -81.3 | -306.9 | -306,4 | -322.8 | -319.8 | -336.8 | -332.0 |
| Other general and administrative expenses | -65.3 | -64.5 | -218.6 | -212.8 | -231.5 | -222.7 | -241.7 | -237.0 |
| of which Balance sheet tax | -8.3 | -8.3 | -32.5 | -32.6 | -33.0 | -33.1 | -35.6 | -35.6 |
| Depreciation and amortisation | -15.6 | -15.2 | -57.2 | -54.5 | -57.5 | -54.6 | -59.2 | -58.8 |
| Total costs | -161.6 | -161.0 | -585.6 | -573.7 | -612.3 | -597.1 | -626.1 | -627.8 |
| Result before impairments and provisions | 158.3 | 155.7 | 654.8 | 638.6 | 633.9 | 635.6 | 634.8 | 647.0 |
| Net impairments and provisions (sum of below) | -34.0 | -34.0 | -30.8 | -36.4 | -64.6 | -61.3 | -67.6 | -68.0 |
| Impairments and provisions for credit risk | -34.0 | -31.4 | -24.7 | -27.2 | -53.9 | -51.3 | -57.7 | -58.7 |
| Other impairments and provisions | -3.6 | -3.0 | -11.2 | -11.1 | -10.7 | -10.0 | -8.6 | -9.3 |
| Gains less losses from capital investments in subsidiaries. associates and JVs | 0.3 | 0.0 | 2.3 | 2.1 | 2.0 | 2.0 | 2.3 | 2.2 |
| Result before tax | 125.0 | 121.7 | 629.2 | 604.3 | 577.6 | 576.2 | 571.1 | 581.2 |
| Income tax expense | -19.6 | -17.4 | -81.4 | -74.2 | -77.9 | -69.5 | -82.1 | -81.9 |
| Non controlling interests | -3.0 | -2.8 | -13.3 | -13.6 | -12.7 | -13.1 | -12.5 | -12.5 |
| Net profit attributable to shareholders | 103.4 | 101.5 | 526.6 | 516.5 | 494.1 | 493.6 | 475.8 | 486.9 |
| Key Ratios | 2024E | 2025E | 2026E | |||
|---|---|---|---|---|---|---|
| Median | Average | Median | Average | Median | Average | |
| NPL ratio | 1.6% | 1.8% | 2.0% | 1.8% | 1.8% | 1.8% |
| Net loans to deposits | 73.1% | 71.4% | 72.8% | 71.8% | 74.1% | 73.0% |
| CET1 ratio | 15.8% | 15.7% | 16.1% | 16.0% | 16.4% | 16.83% |
| Total capital ratio | 19.4% | 18.8% | 19.5% | 19.9% | 19.7% | 20.1% |
| Loan growth | 14.2% | 12.6% | 7.7% | 7.7% | 7.2% | 7.3% |
| Deposit growth | 5.3% | 5.4% | 5.8% | 5.6% | 5.9% | 5.5% |
| Net interest margin | 3.4% | 3.4% | 3.2% | 3.3% | 3.0% | 3.1% |
| Cost of risk | 0.17% | 0.18% | 0.35% | 0.32% | 0.32% | 0.33% |
| Cost to income ratio | 44.9% | 45.2% | 46.7% | 46.4% | 47.2% | 46.9% |
| ROA | 1.9% | 1.9% | 1.7% | 1.7% | 1.6% | 1.6% |
| ROE | 17.0% | 16.6% | 14.6% | 14.5% | 13.5% | 13.5% |
| RWA | 16,864 | 16,764 | 17,740 | 17,916 | 18,931 | 19,071 |
| Dividends | 11.75 | 11.99 | 12.45 | 12.11 | 12.50 | 12.61 |
Seznam za primerjavo je prazen
Na primerjalnem seznamu ni shranjenih izračunov. Za primerjavo morate dodati nekaj izračunov.